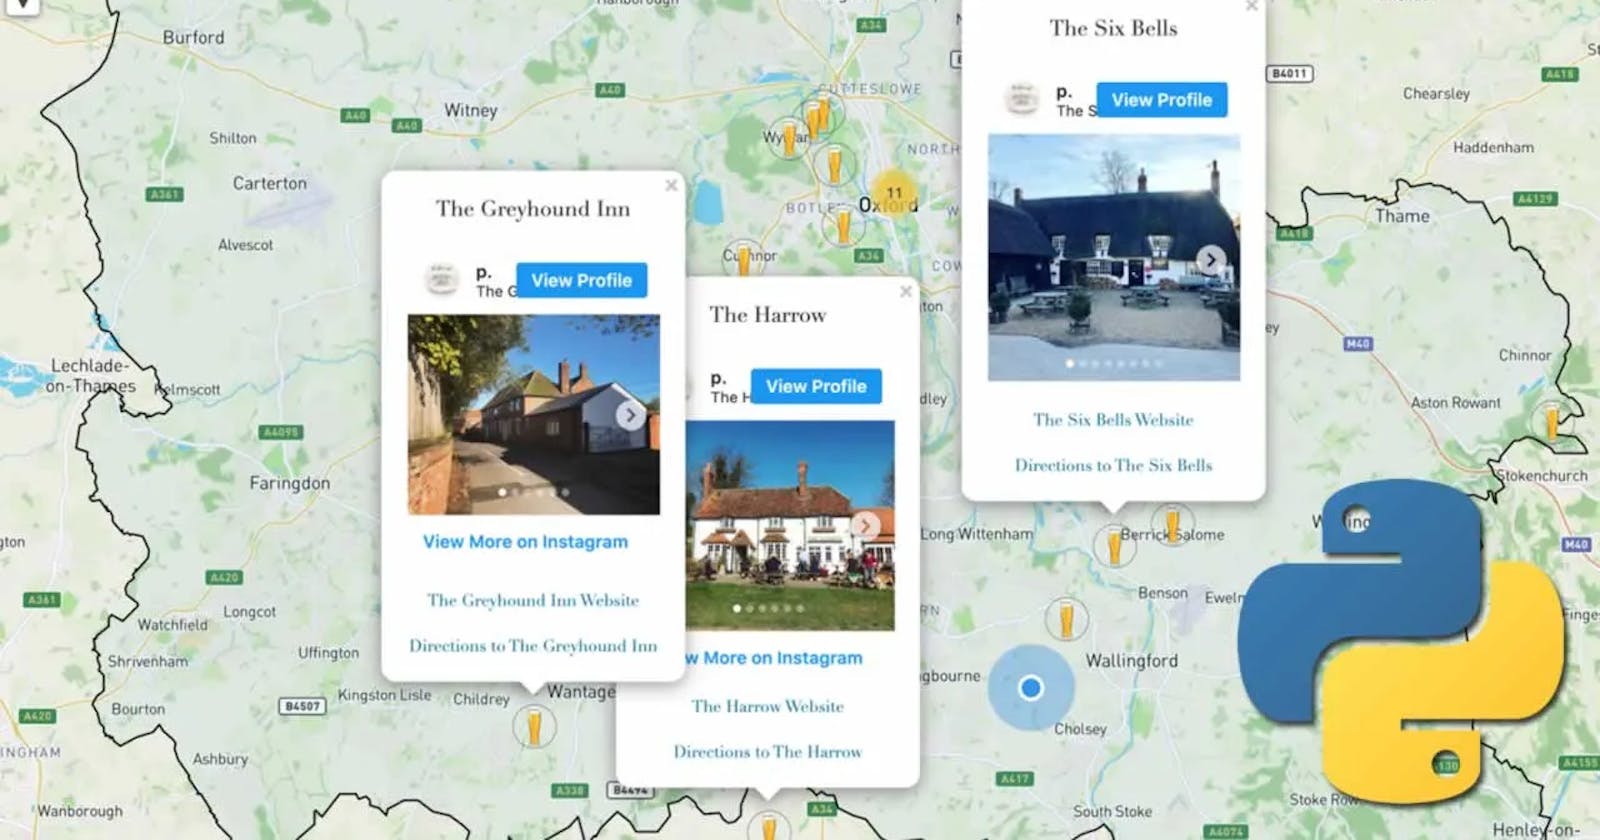


In this blog we will discuss how to create maps with Python by using one of most popular and amazing library of python programming language and that is Folium.
What is Folium?
Folium is a powerful Python library that helps you create several types of Leaflet maps. The fact that the Folium results are interactive makes this library very useful for dashboard building. Folium builds on the data wrangling strengths of the Python ecosystem and the mapping strengths of the Leaflet.js library. Manipulate your data in Python, then visualize it in on a Leaflet map via Folium.
Folium makes it easy to visualize data that's been manipulated in Python on an interactive Leaflet map. It enables both the binding of data to a map for choropleth visualizations as well as passing Vincent/Vega visualizations as markers on the map.
The library has a number of built-in tilesets from OpenStreetMap, Mapbox, and Stamen, and supports custom tilesets with Mapbox or Cloudmade API keys. Folium supports both GeoJSON and TopoJSON overlays, as well as the binding of data to those overlays to create choropleth maps with color-brewer color schemes.
Installation and Implementation
Lets install Folium. It is not available by default. So, we first need to install it before we are able to import it.
!conda install -c conda-forge folium=0.5.0 --yes
import folium

print('Folium installed and imported!')
once you are done with the installation you can now easily generate maps using it.Generating the world map is straightforward in Folium. You simply create a Folium Map object, and then you display it. What is attractive about Folium maps is that they are interactive, so you can zoom into any region of interest despite the initial zoom level.
# define the world map
world_map = folium.Map()

# display world map
world_map
when you run the above code you can see the output shown below in the image which is showing the map of the world
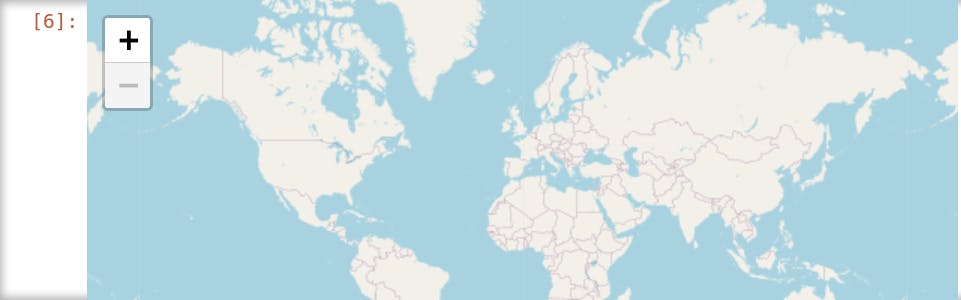
You can even zoom in and out the map by clicking on + and - signs shown in output. All locations on a map are defined by their respective Latitude and Longitude values. So you can create a map and pass in a center of Latitude and Longitude values of [0, 0].
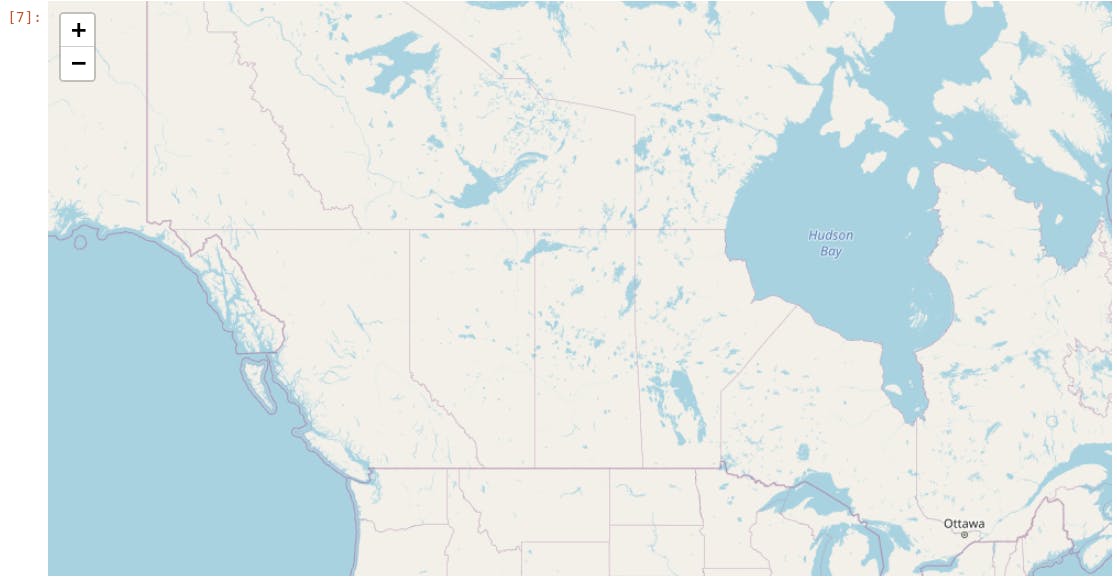
For a defined center, you can also define the initial zoom level into that location when the map is rendered. The higher the zoom level the more the map is zoomed into the center.
Let's create a map centered around Canada and play with the zoom level to see how it affects the rendered map.By running below code this will display map with initial zoom level of 4.
# define the world map centered around Canada with a low zoom level
world_map = folium.Map(location=[56.130, -106.35], zoom_start=4)

# display world map
world_map
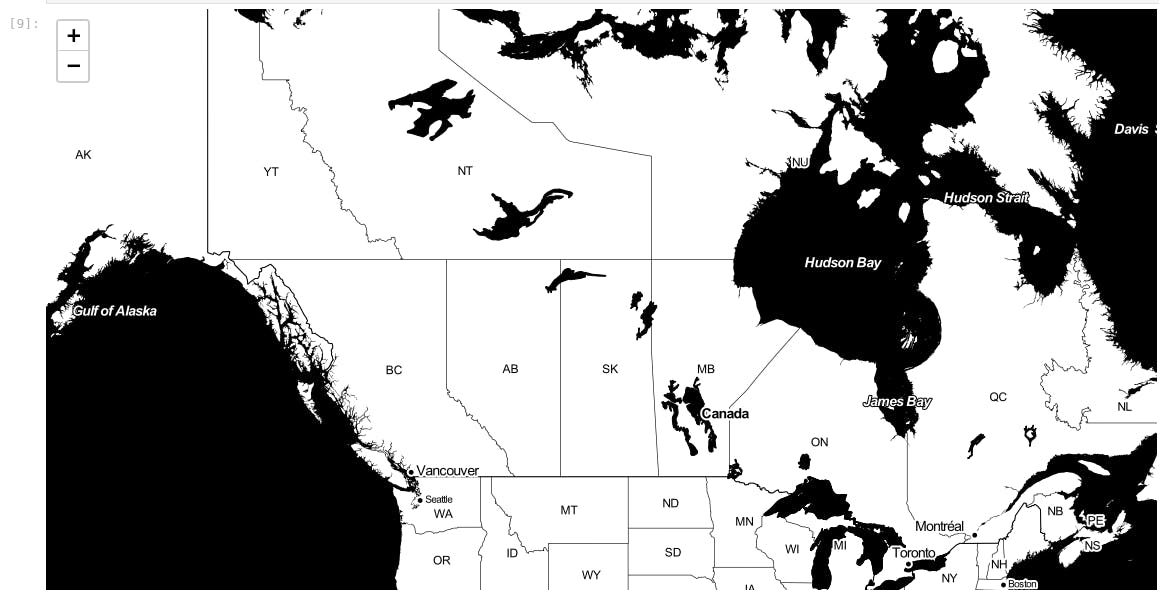
Another cool feature of Folium is that by using this we can generate different map styles.
1) Stamen Toner Map.
These are high-contrast B+W (black and white) maps. They are perfect for data mashups and exploring river meanders and coastal zones.
Let's create a Stamen Toner map of canada with a zoom level of 4.
# create a Stamen Toner map of the world centered around Canada
world_map = folium.Map(location=[56.130, -106.35], zoom_start=4, tiles='Stamen Toner')

# display map
world_map
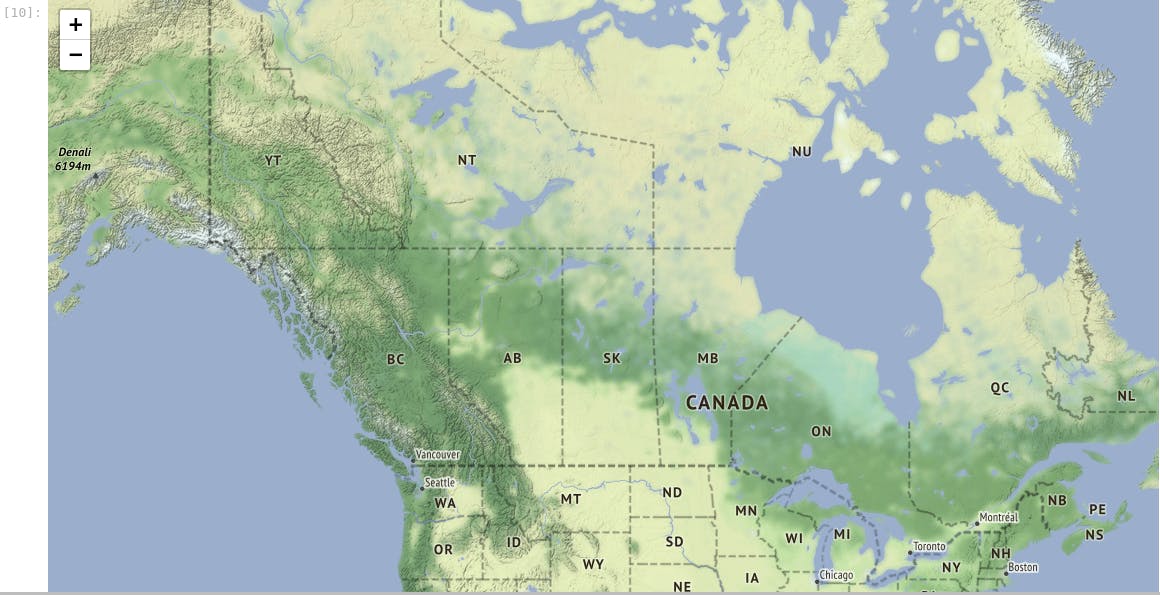
2)Stamen Terrain Maps
These are maps that feature hill shading and natural vegetation colors. They showcase advanced labeling and linework generalization of dual-carriageway roads.
# create a Stamen Toner map of the world centered around Canada
world_map = folium.Map(location=[56.130, -106.35], zoom_start=4, tiles='Stamen Terrain')

# display map
world_map
 Hope it helps!
Cheers!!
Hope it helps!
Cheers!!