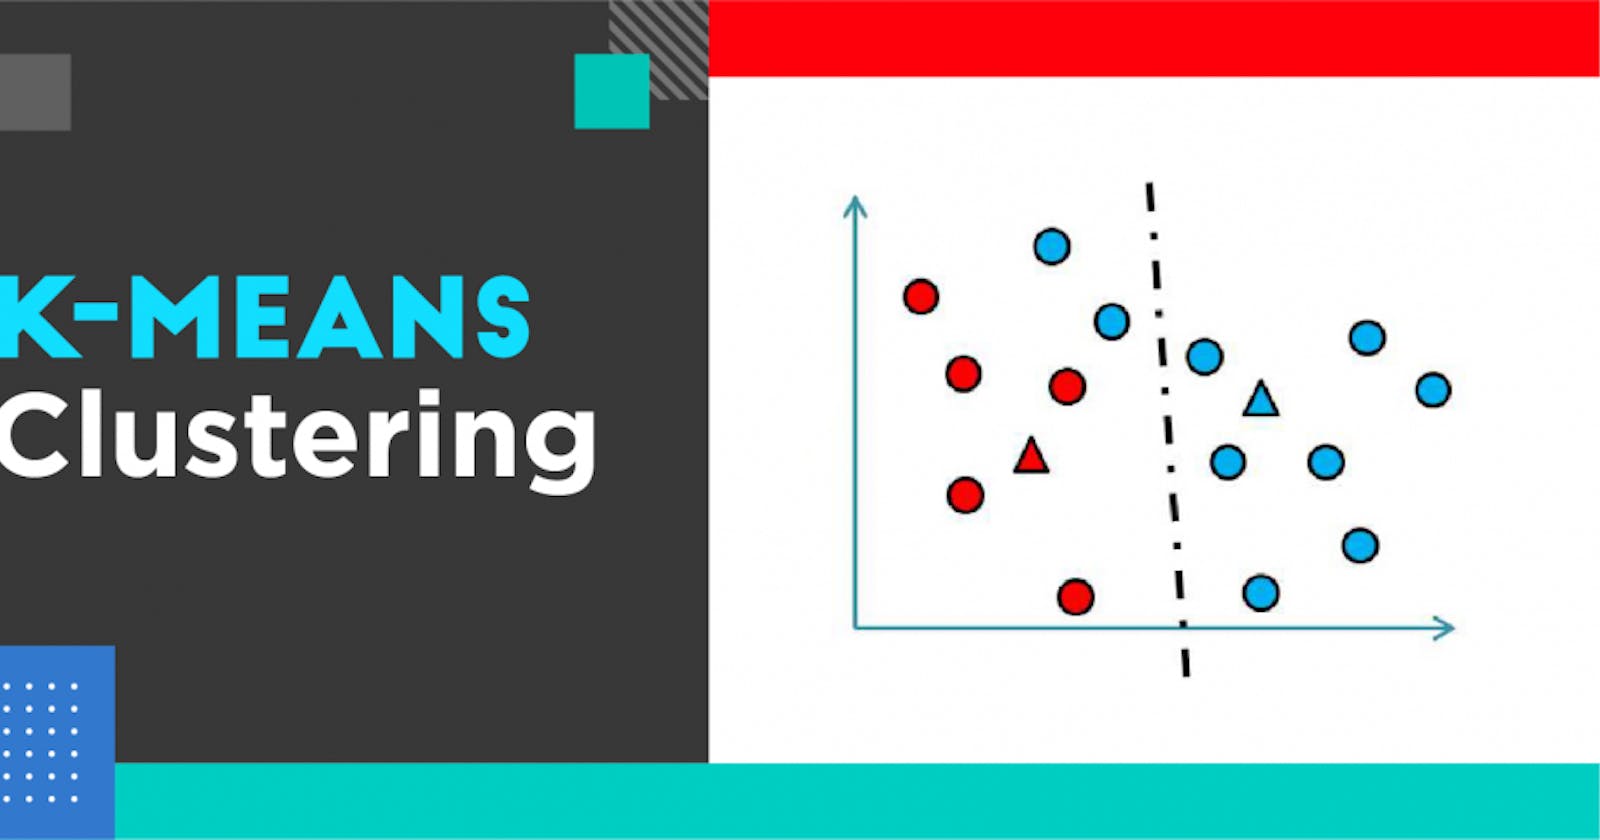


In this blog we will be discussing one of the most popular algorithm of unsupervised learning i.e K-Means Algorithm.We will be taking the customer dataset as an example and we will apply segmentation on this dataset using K-mean Clustering.
What is Customer segmentation?
Customer segmentation is the practice of partitioning a customer base into groups of individuals that have similar characteristics. It is a significant strategy as a business can target these specific groups of customers and effectively allocate marketing resources. For example, one group might contain customers who are high-profit and low-risk, that is, more likely to purchase products, or subscribe for a service. A business task is to retaining those customers. Another group might include customers from non-profit organizations. And so on.
K-Means Algorithm
Kmeans algorithm is an iterative algorithm that tries to partition the dataset into Kpre-defined distinct non-overlapping subgroups (clusters) where each data point belongs to only one group. It tries to make the intra-cluster data points as similar as possible while also keeping the clusters as different (far) as possible. It assigns data points to a cluster such that the sum of the squared distance between the data points and the cluster’s centroid (arithmetic mean of all the data points that belong to that cluster) is at the minimum. The less variation we have within clusters, the more homogeneous (similar) the data points are within the same cluster. The way kmeans algorithm works is as follows:
- Specify number of clusters K.
- Initialize centroids by first shuffling the dataset and then randomly selecting K data points for the centroids without replacement.
- Keep iterating until there is no change to the centroids. i.e assignment of data points to clusters isn’t changing.
- Compute the sum of the squared distance between data points and all centroids.
- Assign each data point to the closest cluster (centroid).
- Compute the centroids for the clusters by taking the average of the all data points that belong to each cluster.
Imlementation
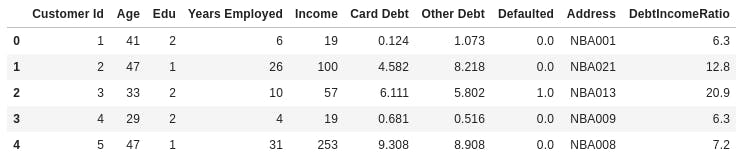
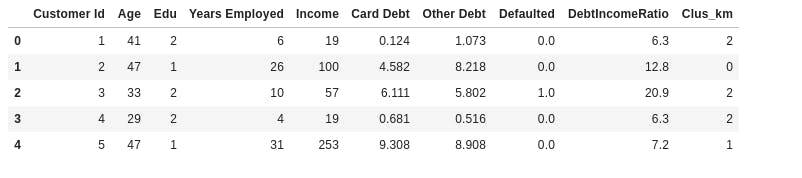
Here we will implement k-Means algorithm on customer dataset.Load Data from CSV File.
import pandas as pd
cust_df = pd.read_csv("Cust_Segmentation.csv")
cust_df.head()
You will get this after loading data
Preprocessing
As you can see, Address in this dataset is a categorical variable. k-means algorithm isn't directly applicable to categorical variables because Euclidean distance function isn't really meaningful for discrete variables. So, lets drop this feature and run clustering.
df = cust_df.drop('Address', axis=1)
df.head()
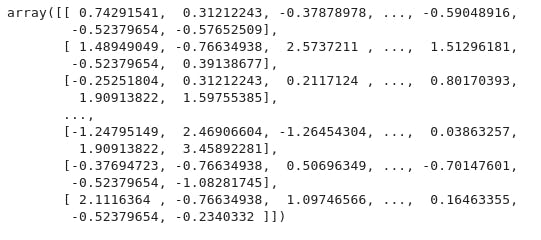
Normalizing over the standard deviation Now let's normalize the dataset. But why do we need normalization in the first place? Normalization is a statistical method that helps mathematical-based algorithms to interpret features with different magnitudes and distributions equally. We use StandardScaler() to normalize our dataset.
from sklearn.preprocessing import StandardScaler
X = df.values[:,1:]
X = np.nan_to_num(X)
Clus_dataSet = StandardScaler().fit_transform(X)
Clus_dataSet
Modeling
In our example (if we didn't have access to the k-means algorithm), it would be the same as guessing that each customer group would have certain age, income, education, etc, with multiple tests and experiments. However, using the K-means clustering we can do all this process much easier.
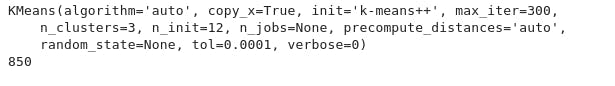
Lets apply k-means on our dataset, and take look at cluster labels
clusterNum = 3
k_means = KMeans(init = "k-means++", n_clusters = clusterNum, n_init = 12)
print(k_means)
k_means.fit(X)
labels = k_means.labels_
print(len(labels))
Insights
We assign the labels to each row in dataframe.
df["Clus_km"] = labels
df.head(5)
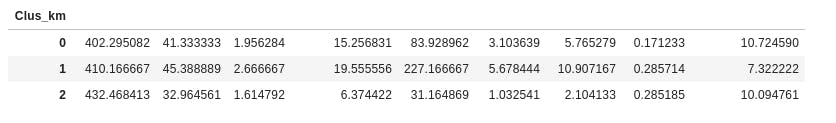
We can easily check the centroid values by averaging the features in each cluster.
df.groupby('Clus_km').mean()
Now, lets look at the distribution of customers based on their age and income:
area = np.pi * ( X[:, 1])**2
plt.scatter(X[:, 0], X[:, 3], s=area, c=labels.astype(np.float), alpha=0.5)
plt.xlabel('Age', fontsize=18)
plt.ylabel('Income', fontsize=16)

plt.show()

from mpl_toolkits.mplot3d import Axes3D
fig = plt.figure(1, figsize=(8, 6))
plt.clf()
ax = Axes3D(fig, rect=[0, 0, .95, 1], elev=48, azim=134)

plt.cla()
# plt.ylabel('Age', fontsize=18)
# plt.xlabel('Income', fontsize=16)
# plt.zlabel('Education', fontsize=16)
ax.set_xlabel('Education')
ax.set_ylabel('Age')
ax.set_zlabel('Income')

ax.scatter(X[:, 1], X[:, 0], X[:, 3], c= labels.astype(np.float))
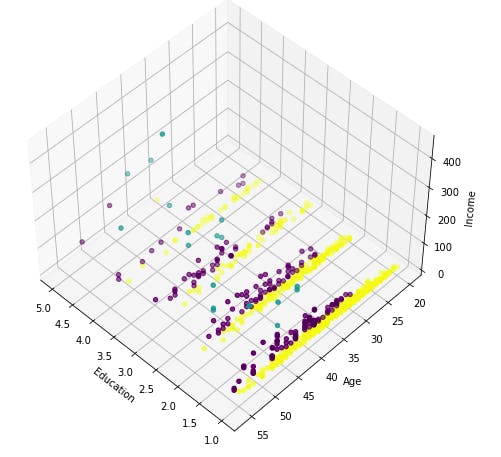
k-means will partition your customers into mutually exclusive groups, for example, into 3 clusters. The customers in each cluster are similar to each other demographically. Now we can create a profile for each group, considering the common characteristics of each cluster. For example, the 3 clusters can be:
AFFLUENT, EDUCATED AND OLD AGED
MIDDLE AGED AND MIDDLE INCOME
YOUNG AND LOW INCOME
I hope you find it useful. Cheers!!